Systems thinkingEnterprise systems mappingStakeholder researchExperience mappingService blueprinting
275 steps, 12 stakeholder groups: making a Fortune 500 product data ecosystem visible enough to redesign
Ferguson's product data moved through 12 stakeholder groups across 275 steps that no one inside the company had ever seen end to end. I helped lead the experience map that made it visible for the first time, and contributed to the service blueprints and four year roadmap that secured funding for future phases.
Client
Ferguson Enterprises
Role
Service Designer
Team
4 to 5 people · Sep 2022 to Jan 2023
Status
Public case study, via Harmonic Design
The brief
Ferguson is the largest value added distributor serving specialized professionals in the North American residential and nonresidential construction market: plumbing, HVAC, appliances, lighting, and more. The business had grown significantly, but its internal systems hadn't kept pace. Its product data team managed tens of thousands of vendors and hundreds of thousands of products through manual spreadsheet entry, each requiring time consuming enrichment, normalization, vetting, and upload to an inefficient database.
Nobody inside the company had ever seen that journey end to end. Every department understood its own slice and operated almost as its own entity under a shared umbrella: the kind of system you don't dare touch, because you can't see where to begin. Before any future state, we had to make the system visible.
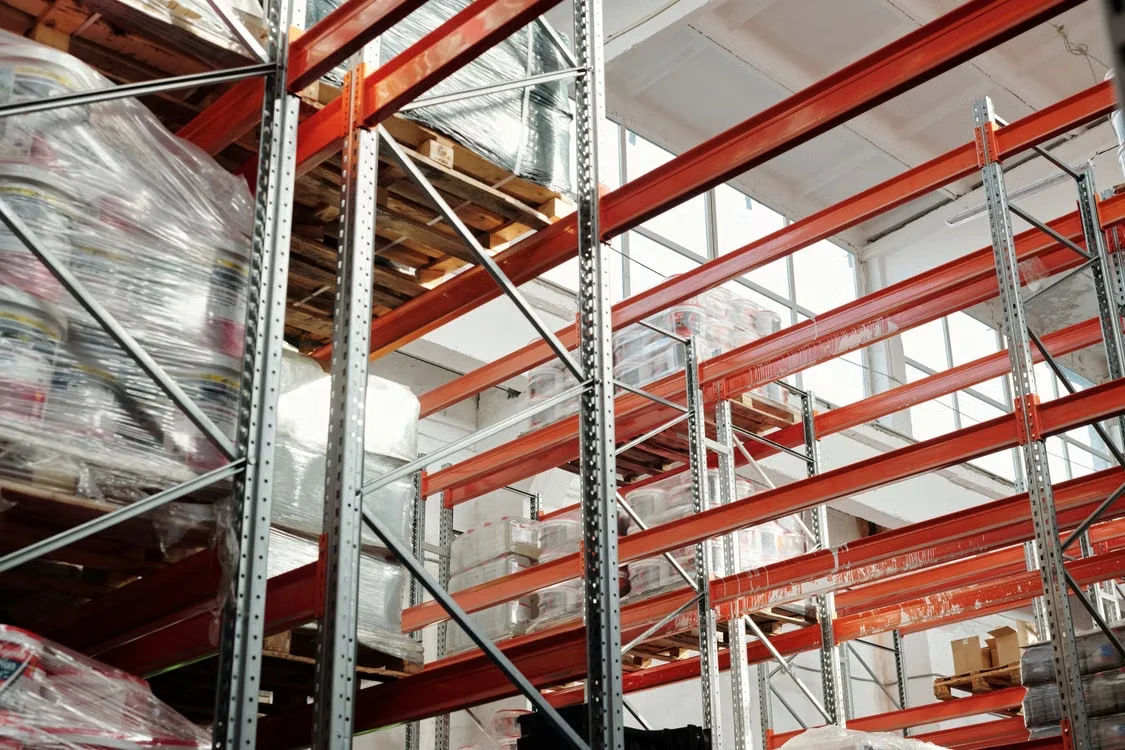
The distribution floor behind the data
Research at organizational scale
We interviewed stakeholders across every group that touched product data. I supported facilitation, contributed to synthesis, and helped build the product data touchpoint inventory: for each touchpoint, which actors were involved, which data types moved through it, and which pain points were attached. Slicing the research that way meant anyone could pull up a single touchpoint and understand it without reading pages of notes.
But making sense of the whole thing felt like standing in a room where everyone spoke a different language at once. The same HVAC or plumbing part had a different name in every department, so each handoff meant extra translation, extra confusion, extra points of failure. Every interview surfaced another partial view of the same system. We needed a tool that could hold it all in one place.
The experience map, what I helped lead
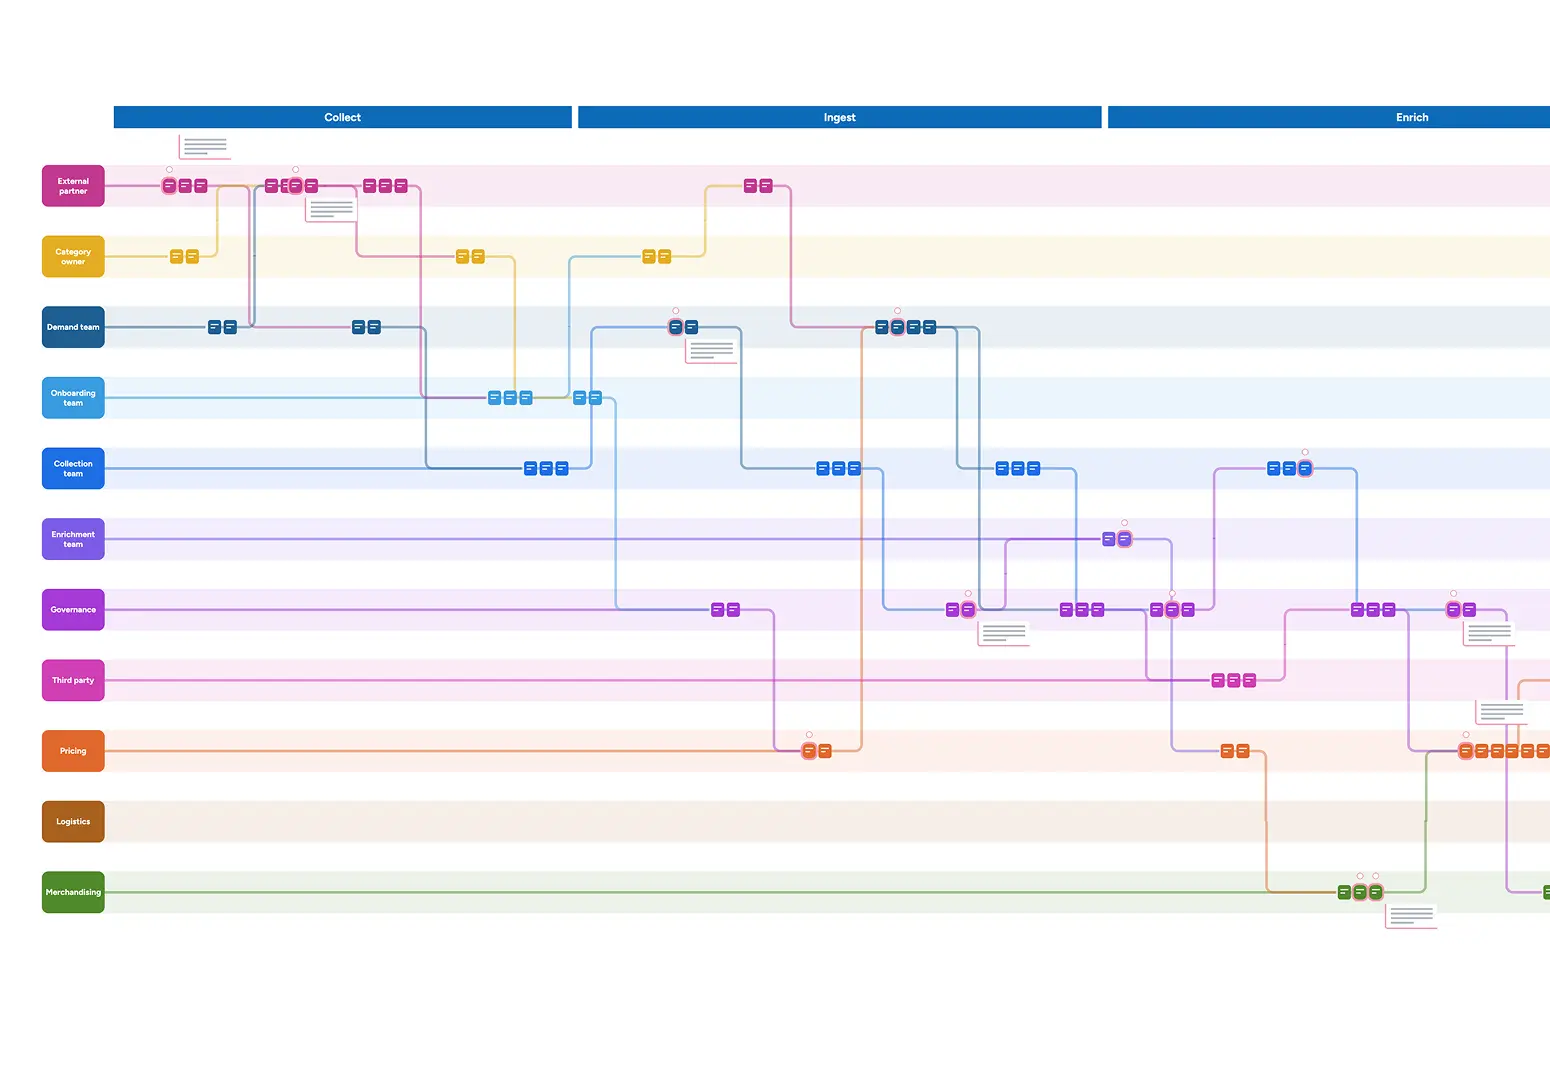
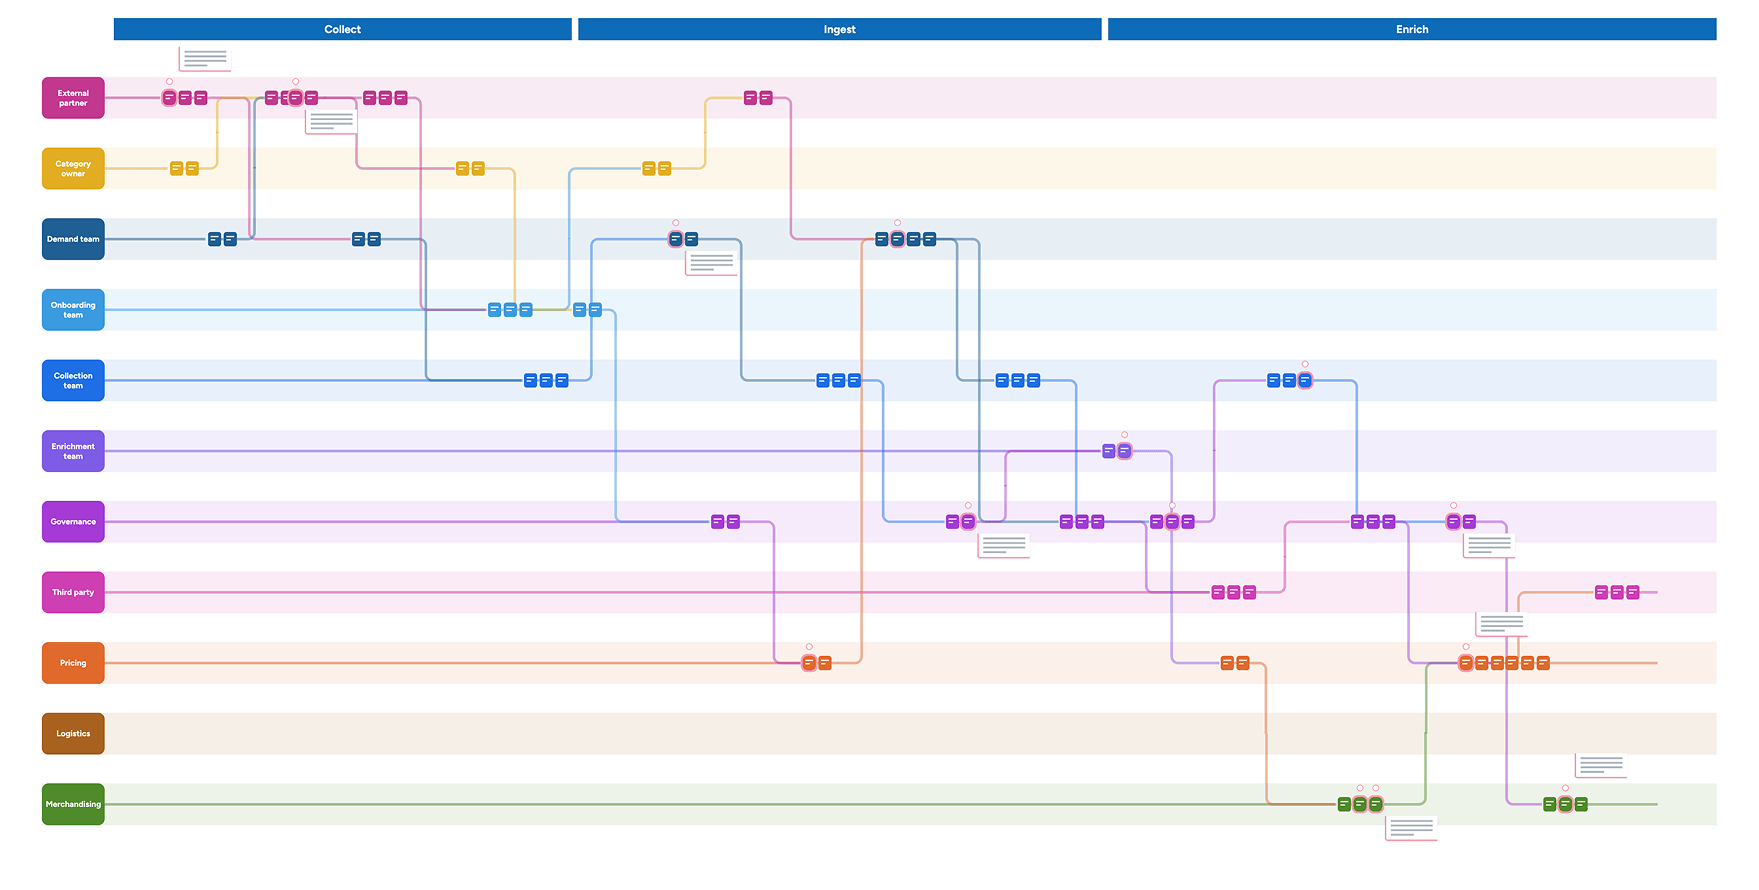
That tool was the experience map: a single view of the end to end experience across 12 stakeholder groups, from suppliers providing product information to content teams enriching it and data teams normalizing it. Instead of following one protagonist, it followed the product data itself as it moved through the organization: every actor lane, handoff, gap, and breakdown visible at once.
As a team, we built an experience map spanning more than 275 steps that surfaced gaps, inefficiencies, and critical failure points across the entire data ecosystem. My contribution was finding the best way to visually represent that complexity and make something this dense actually readable.
“People who had worked at the company for years were seeing the full flow for the first time, like putting on glasses and realizing how much they'd been missing.”
Experience map, partial view
From map to workshop to roadmap
The experience map became the foundation for a series of opportunity workshops, bringing together a cross functional team to understand their role in the data workflow and help create concepts for a new solution. Stakeholders who'd never had a reason to talk to each other were suddenly pointing at the same handoff, the same broken translation, the same bottleneck they'd each been working around in isolation. Together, we prioritized the key pain points and identified opportunities for a new product data ingestion and enrichment solution.
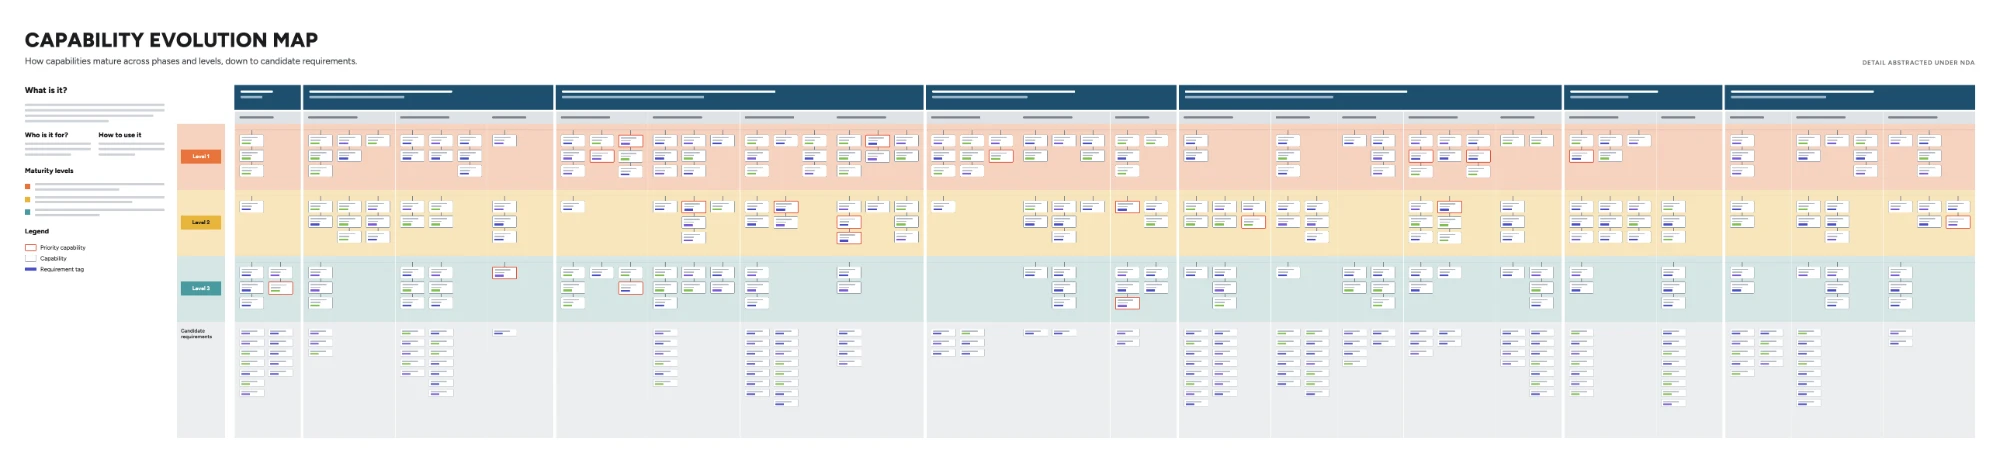
From there, we ran service blueprinting sessions with cross functional teams, mapping the front stage and back stage elements needed to deliver the future state: covering the major product data flows, from supplier onboarding to data collection and validation to ready to sell. The closing service evolution maps used backcasting, working backward from the envisioned future state through three time horizons to identify which capabilities had to land in each one.
12
stakeholder groups
275+
steps mapped
290+
capabilities identified
4 yr
roadmap
The result was a detailed evolution map outlining more than 290 business and service capabilities that would need to be modified or created. That plan became the four year roadmap, giving the team confidence to build implementation plans, estimate four years out, make a convincing business case, and secure funding for future phases.
Capability evolution map, detail abstracted under NDA
“We didn't get to a 275 step map by moving fast. We got there by talking to stakeholders across twelve functional groups and building something rigorous enough to hold everything they told us. I can hold that kind of complexity, map it, make it legible, and give an organization a place to start.”
What I helped lead: experience map, touchpoint inventory, synthesis and takeaway writing. What I supported: stakeholder interviews across functional groups, opportunity workshop, blueprint and evolution map development.